EMF Dashboard
Solar Wind Speed (Rice)
Learn more
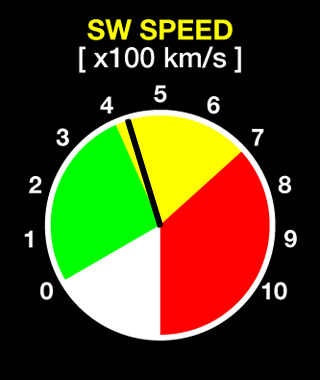
This gauge shows the current solar wind speed, measured in hundreds of kilometers per second (km/s), flowing from the Sun toward Earth.
What you're seeing:
Green = normal (low-speed wind, ~300–500 km/s)
Yellow = elevated
Red = very fast solar wind (700+ km/s), often from coronal holes or solar eruptions.
Why it matters:
High-speed solar wind can disturb Earth’s magnetic field, trigger auroras, and affect satellite systems, radio, and GPS.
How to read it:
Green = quiet
Yellow = increased energy in the solar wind
Red = storm-capable and may indicate potential geomagnetic disturbances if other conditions are favorable (like magnetic polarity).
This is one of the most important indicators for near-Earth space weather impacts.
Solar Wind Pressure (Rice)
Learn more
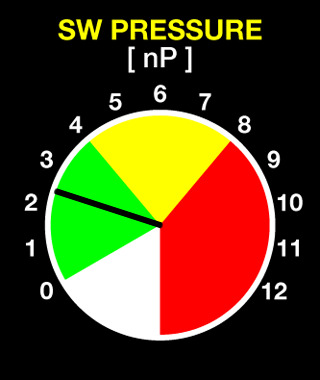
This gauge displays solar wind pressure, measured in nanopascals (nPa). It reflects the force exerted by the solar wind as it presses against Earth’s magnetic shield.
What you're seeing:
Green = low pressure (normal background solar wind)
Yellow = moderately increased
Red = high pressure, often linked to solar storms or CMEs (coronal mass ejections)
Why it matters:
Increased pressure compresses Earth’s magnetosphere, making it easier for energetic particles to enter the atmosphere. This can intensify auroras and disrupt communication systems.
How to read it:
• 1–3 nPa = typical during quiet solar conditions
• 5–10 nPa = may indicate active solar wind
• 10+ nPa = high and often a precursor or part of a geomagnetic storm
Pressure spikes, when combined with high wind speeds and southward magnetic fields, are a classic recipe for geomagnetic activity.
IMF Clock Angle
Learn more
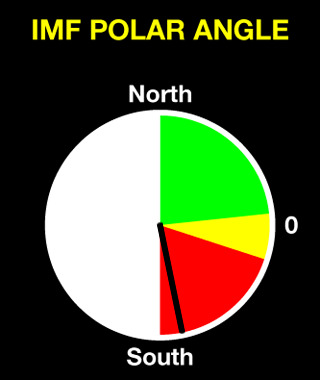
This gauge shows the Interplanetary Magnetic Field (IMF) Clock Angle, which indicates the direction of the solar magnetic field near Earth. It’s a polar angle where:
- 0° = North (upward)
- 180° = South (downward)
Why it matters:
When the angle points southward (≈180°), it's more geoeffective. That means the solar magnetic field is oriented in a direction that more easily merges with Earth's magnetic field, allowing more energy to enter the magnetosphere.
What you're seeing:
Green/Yellow zones = Northward or neutral — typical quiet conditions
Red zone = Southward — higher risk of geomagnetic activity
How to read it:
Normal conditions keep the needle pointed toward the white or green zones. When the needle points toward the red (south), the risk of geomagnetic storms rises sharply. This metric is most useful when interpreted alongside solar wind speed and pressure, especially for forecasting auroras or satellite interference.
Coronal Mass Ejection – LASCO C2
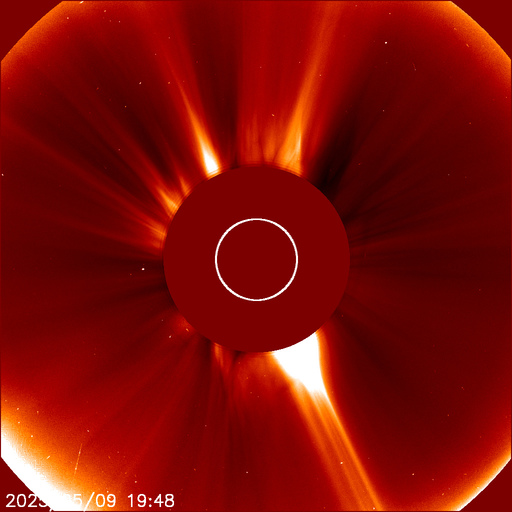
Latest solar imagery from LASCO C2 (SOHO satellite). Image updates approximately every 30 minutes.
View full CME animation & data
Learn more
What you’re seeing:
- Bright, fan-like bursts of plasma and light moving away from the Sun — these are coronal mass ejections, or CMEs.
- The rays and arcs are solar material (plasma) being hurled into space.
- The darker red background is the space around the Sun, made visible by blocking the blinding light of the solar surface.
Relevance:
CMEs are one of the most powerful drivers of space weather. If directed toward Earth, they can trigger strong geomagnetic storms that affect satellites, power grids, GPS, and radio communications.
How to read it:
- Normal: A calm image with no obvious large structures or movement outward.
- Moderate activity: A single burst in one direction — may or may not be Earth-directed.
- Significant or extreme activity: A full halo or semi-circle burst appearing to expand outward in all directions — a likely Earth-directed CME.
This data is updated roughly every 30 minutes and is often followed by analysis of whether the CME is heading toward Earth. A CME impact can cause geomagnetic storms within 1–3 days, depending on its speed.
SUSANOO Solar Wind Propagation
Learn more
This animation shows a model simulation of how solar wind travels from the Sun through the solar system toward Earth. It’s produced by the SUSANOO system, a Japanese forecasting tool that uses physics-based models to predict solar wind behavior and its potential impact on Earth.
What you're seeing:
- The Sun is at the center.
- Earth is one of the small dots on the outer track (near the right side).
- Colored regions show the density of solar wind:
Blue = low density (calm),
Yellow/Red = high density (more energy, more pressure).
These waves or bursts moving outward from the Sun are either background solar wind or shock fronts caused by solar eruptions like CMEs.
Why it matters:
Tracking how solar wind structures move toward Earth helps predict space weather events. If a high-density region (yellow/red) is directed toward Earth, it could compress Earth's magnetosphere and trigger geomagnetic storms.
Normal vs Disturbed:
- Normal: Mostly blue background, with no dense structures heading toward Earth.
- Active: Yellow regions moving near or toward Earth indicate incoming solar wind increases.
- Extreme: Large, fast red zones directed at Earth can lead to strong geomagnetic storms and potential disruptions in power, satellites, and communication.
This tool provides a forecast-like view of the structure and timing of solar wind that may affect Earth's magnetic field in the coming days.
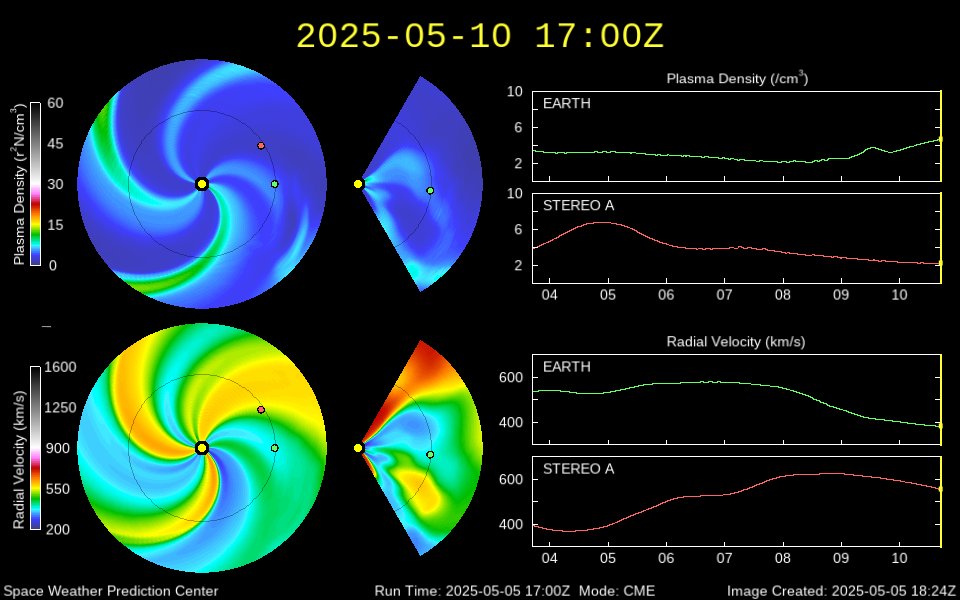
ENLIL Solar Wind Prediction
Learn more
This animation shows a computer simulation of solar wind movement through the solar system, using the ENLIL model. It’s a forecasting tool used to project the trajectory and speed of solar wind structures, especially after a solar eruption.
What you're seeing:
- The frames show density and velocity of solar wind from top-down and side perspectives.
- Earth is a small white or blue dot.
- Colored zones show solar wind conditions:
Blue/Green = calm,
Yellow/Orange = moderate,
Red = fast and dense — often CME-driven.
Why it matters:
When these structures are Earth-directed, they can trigger geomagnetic storms. ENLIL is used to forecast possible arrival times and the severity of impact from solar eruptions.
Normal vs Disturbed:
- Normal: Mostly green/blue zones, indicating average wind speeds and low density.
- Active: Yellow/orange fronts moving toward Earth signal elevated risk.
- Extreme: Compact, fast-moving red zones are often geomagnetic storm drivers.
This tool is most useful for anticipating space weather 1–4 days before impact.
UK Magnetometers (BGS)
Learn more
These real-time graphs come from ground magnetometer stations in the UK: Lerwick, Eskdalemuir, and Hartland. They track changes in Earth’s magnetic field across three components:
- H — Horizontal intensity (red line)
- D — Magnetic declination or compass direction (yellow line)
- Z — Vertical intensity (green line)
What you're seeing:
Spikes, dips, or oscillations in these lines indicate geomagnetic disturbances caused by solar wind or CMEs.
Why it matters:
These disturbances can impact power grids, pipelines, and navigation systems. They are also used to confirm the arrival and severity of solar-driven geomagnetic storms.
How to read it:
- Normal: Flat or gently sloping lines = quiet geomagnetic conditions.
- Active: Small but sustained wave-like movement across all lines.
- Extreme: Sharp spikes, rapid fluctuations, or large deviations indicate intense geomagnetic activity — often from a CME impact.
This tool gives a direct look at how Earth’s magnetic field is responding to space weather in real time, specific to the UK.
Learn more
What you're seeing: The dark circle in the middle blocks the Sun’s disk. The surrounding light structures are part of the Sun’s corona, and any sudden expanding bright loops or outflows are usually CMEs.
Why it matters: CMEs can launch billions of tons of plasma toward Earth. If they’re Earth-directed and fast enough, they can cause geomagnetic storms, disrupt satellites, and even cause transformer damage on the ground.
Normal vs Disturbed: - Normal: A relatively stable, faint halo around the Sun with slow, symmetrical expansion. - Active: Asymmetrical outbursts or fast-moving material, especially if expanding toward the right (Earth-facing direction in most coronagraphs). - Extreme: Very large, bright, and fast CMEs that exit the frame quickly may indicate high-impact geomagnetic potential.
Watching coronagraphs helps space weather analysts issue early warnings for major space weather events before they arrive at Earth.
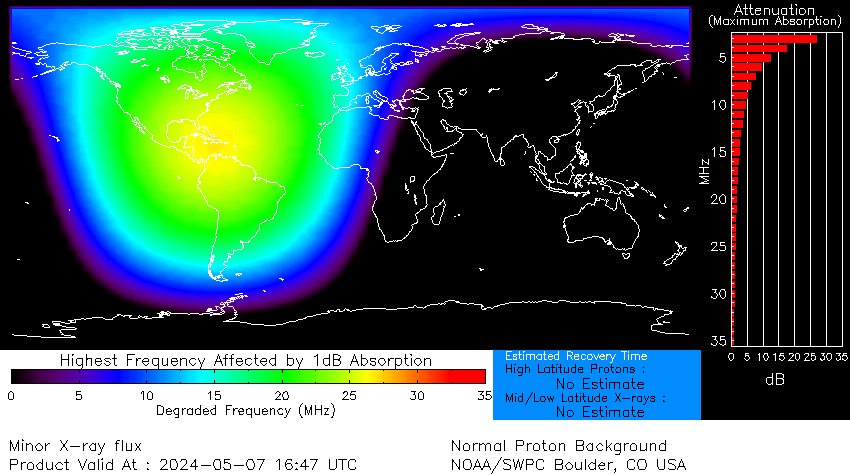
Learn more
What you're seeing: The map shows global regions where radio signals are being absorbed due to ionization from X-rays and energetic protons. Colors represent how strong the absorption is in terms of frequency degradation (measured in MHz). Darker reds and purples show higher absorption levels.
Why it matters: When high levels of ionizing radiation from solar flares or proton events reach Earth, they increase the density of the D-layer in the ionosphere. This causes HF radio signals to be absorbed rather than reflected—cutting off long-distance communication, particularly in polar regions.
Normal vs Disturbed: - Normal: Light colors (blue, green) or a blank map indicate minimal absorption. - Active: Yellow to orange zones mean moderate solar flare activity is impacting radio propagation. - Extreme: Red and purple regions signal major solar flares or proton events that can fully block HF radio over those areas (Radio Blackout Conditions).
This map is especially important for aviation, emergency communications, and any HF users needing to track space weather impacts in real time.
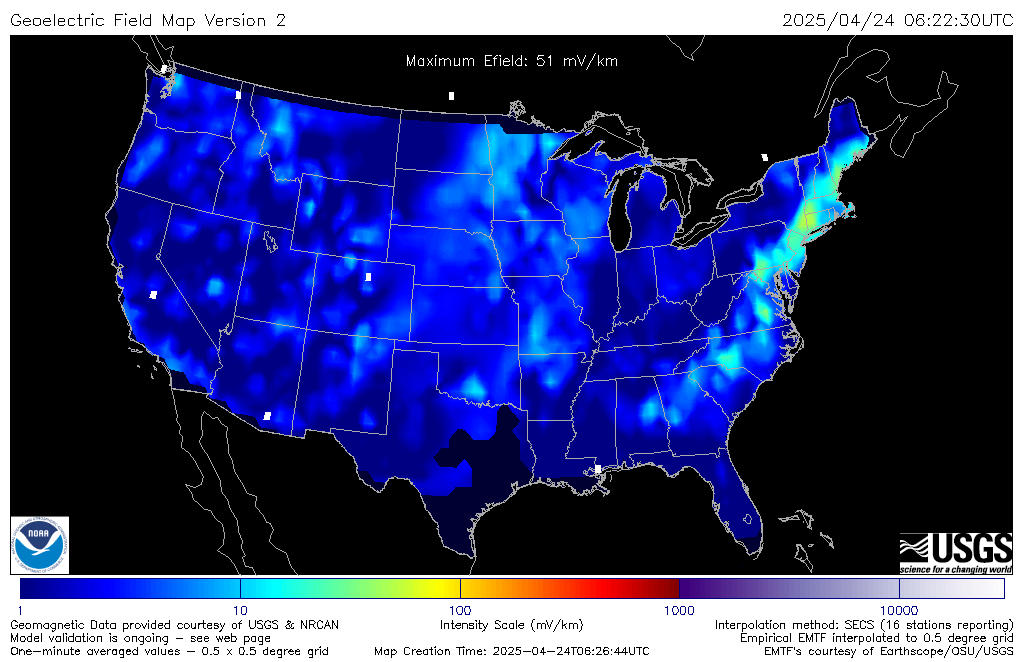
Learn more
What you're seeing: Areas are color-coded to reflect how strong the electric field is in millivolts per kilometer (mV/km). The brighter or redder a region, the stronger the ground currents—these can affect power lines and transformers.
Why it matters: Geomagnetically induced currents (GICs) from space weather events can enter power grids and damage or overload infrastructure. Utilities use this information to anticipate stress on equipment and adjust operations.
Normal vs Disturbed: - Normal: Mostly deep blue or purple (low field values under ~10 mV/km). - Active: Yellow to orange areas show increased potential for minor GICs. - Extreme: Red or white zones (100–1000+ mV/km) suggest a high risk of transformer saturation or grid disturbance.
This map is essential for grid operators but also helps the public understand which regions may be more vulnerable during geomagnetic storms.
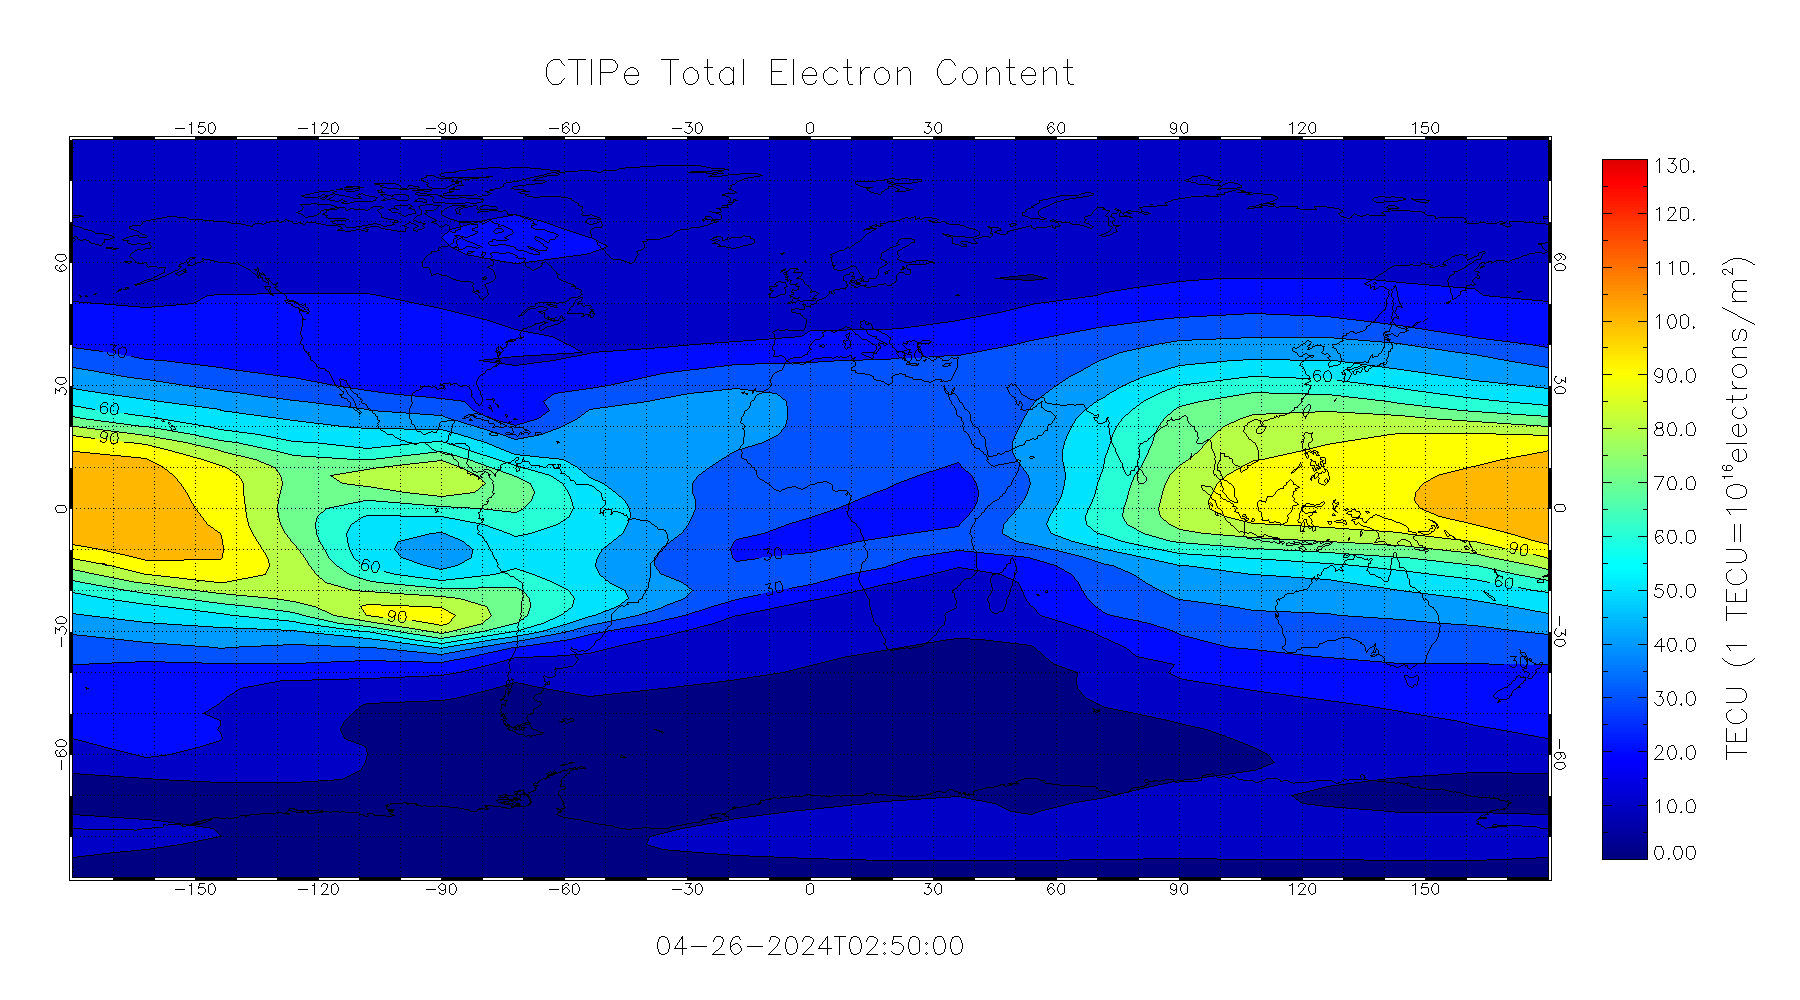
Learn more
What you’re seeing: - TEC values are measured in TEC units (TECU). Warmer colors (red, orange) mean high electron content; cooler colors (blue, purple) indicate low content. - This matters because GPS signals travel through the ionosphere — the more electrons, the more delay or distortion occurs.
Relevance: Monitoring TEC is critical for understanding how solar activity affects communication and navigation systems. During geomagnetic storms, electron content can spike or fluctuate, degrading GPS accuracy and HF radio reliability.
Signs of activity: - Calm conditions: smooth, consistent bands of TEC centered near the equator. - Active or disturbed: patchy TEC, intense spikes, or expansion toward mid-latitudes.
Extreme disturbances can affect aviation, military comms, and precision farming tech that relies on GPS. If you're seeing deep red or fast-moving gradients, expect signal disruptions.
Learn more
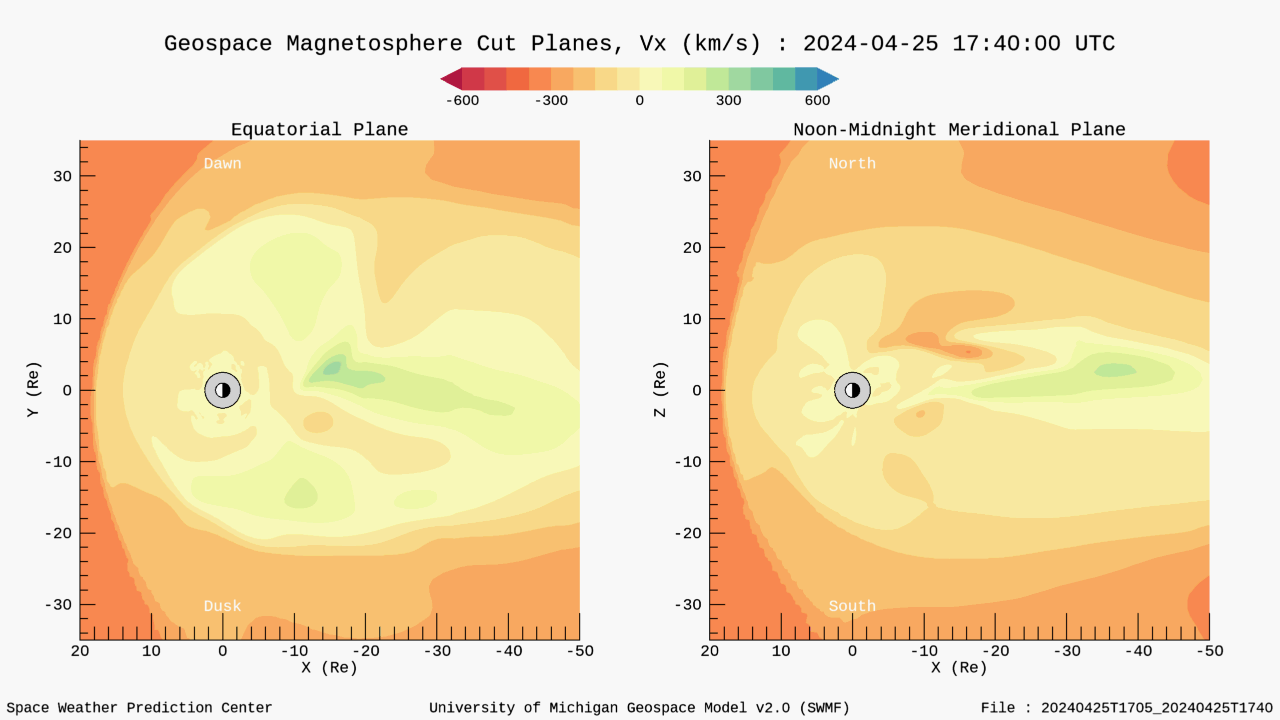
What you’re seeing: - The colors represent speed: dark blues and greens indicate slower movement; yellows and reds indicate high-speed flows. - The data is modeled based on solar wind input and geomagnetic conditions.
Relevance: High-velocity flows indicate strong energy transfer from the solar wind into Earth’s magnetic field. These bursts can disturb the magnetosphere, trigger auroras, or disrupt satellites and power grids.
Normal vs active: - Normal: low velocities, mostly blues and greens, symmetric patterns. - Active: red or yellow regions near the night-side or polar zones, asymmetry, or turbulent shapes.
Extreme disturbances: When fast flows (red/yellow) dominate and stretch across large areas, this may reflect a geomagnetic storm underway. Watch for other factors like Kp index and Bz alignment to confirm.

Learn more
What you’re seeing: - Higher pressure zones appear as brighter or warmer colors (yellow, orange, red), indicating where solar wind energy is compressing Earth’s magnetic field. - Lower pressure areas (blue/green) represent quieter or more expanded field conditions.
Relevance: When solar wind hits Earth’s magnetic field, it compresses it — this creates geomagnetic stress, particularly on the day-side (facing the Sun). It can affect satellites, disrupt communication, and lead to energy grid issues if strong enough.
Normal vs active: - Normal: broad, low-pressure zones; mostly cool tones; symmetric fields. - Active: intense high-pressure blobs near the day-side, especially near the equator and poles.
Extreme disturbances: Sustained red/orange compression regions suggest strong solar wind impact. These are often coincident with geomagnetic storms (Kp ≥ 6) and IMF Bz southward alignments. These can precede auroral activity or technical disruptions.
Learn more
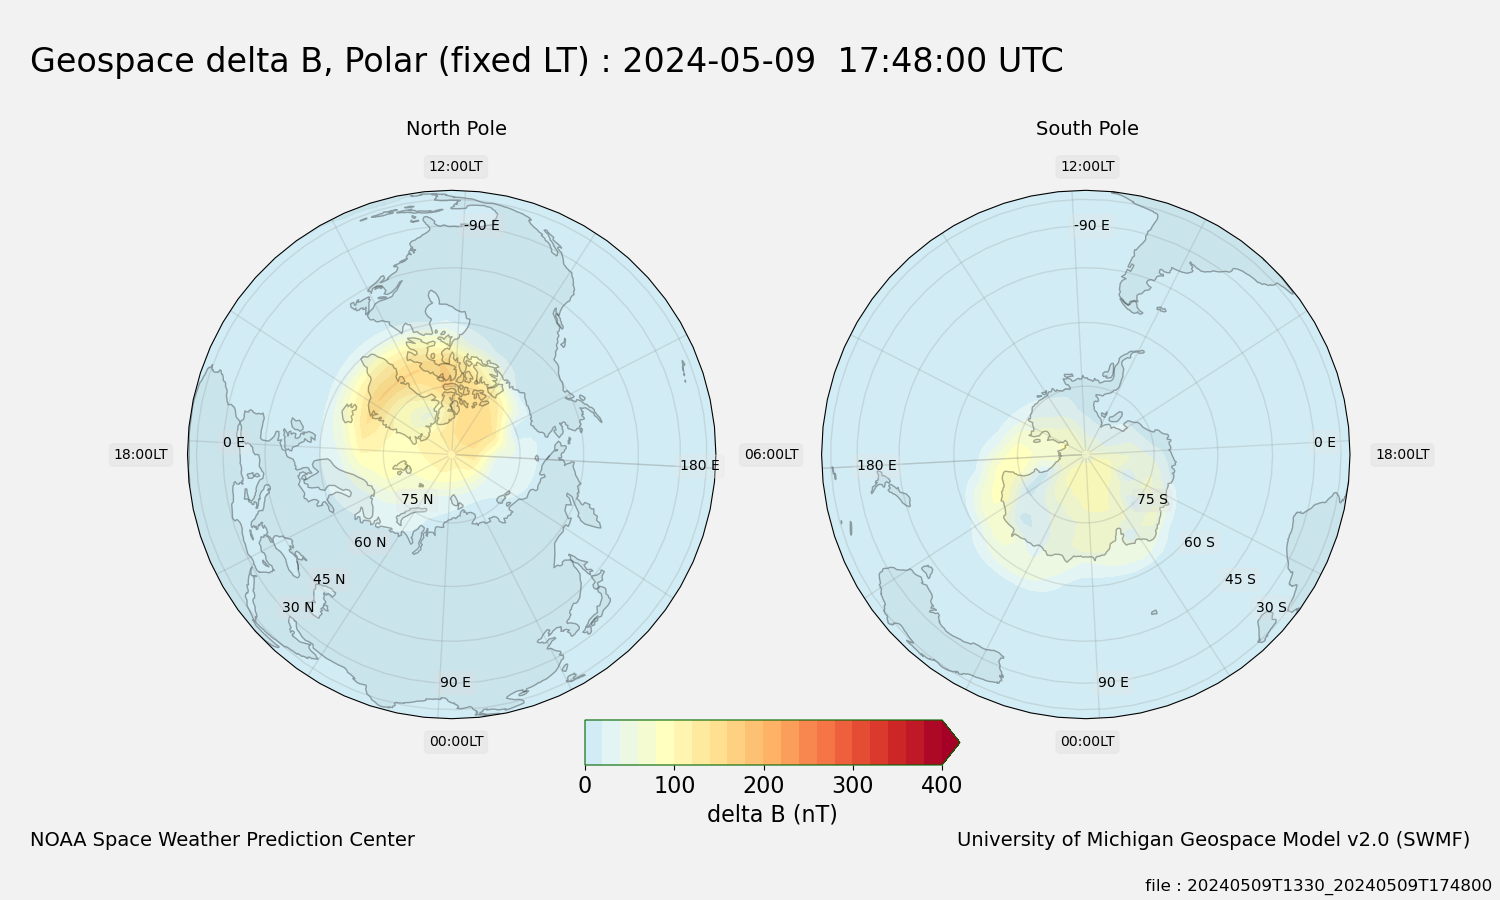
What you’re seeing: - The colored lobes represent areas of ionospheric flow driven by magnetic field lines being pushed or pulled by solar wind. - The shape and intensity of the contours show how disturbed the polar ionosphere is.
Relevance: These flows play a key role in how space weather affects Earth’s upper atmosphere — especially in high-latitude regions. Increased activity here correlates with auroras, GPS disturbances, and airline communication outages on polar routes.
Normal vs active: - Normal: symmetric two-lobed shape with gentle gradients and minimal expansion. - Active: larger, asymmetric lobes extending toward mid-latitudes, with brighter colors and denser electric field lines.
Extreme disturbances: If lobes expand well beyond typical polar bounds or exhibit chaotic patterns, it suggests strong magnetic reconnection — often from sustained negative Bz or CMEs. These are linked with substorms and large auroral events.
Learn more
What you're seeing: - Solar X-ray flux (top left) tracks solar flares. - Proton flux (top middle) reflects high-energy particle levels from solar storms. - Electron flux (top right) relates to radiation belt behavior. - Geomagnetic K-index bars (middle) show recent geomagnetic activity. - GOES satellite magnetometer data and more follow in the bottom panels.
Relevance: This panel provides a quick “all-in-one” dashboard for space weather status. Scientists and forecasters use it to determine whether solar or geomagnetic events are currently active, and what type they are.
Normal vs active: - Normal: X-ray flux flat and in A or B class range, proton/electron flux low and stable, K-index bars below 4. - Active: Flare spikes into C, M, or X range; particle flux increases; geomagnetic bars rise above 5.
Significant activity: If multiple panels show elevated readings — e.g., a strong flare, high proton flux, and elevated Kp — this indicates a complex, potentially disruptive event. These conditions can affect everything from satellites to human physiology.
Learn more
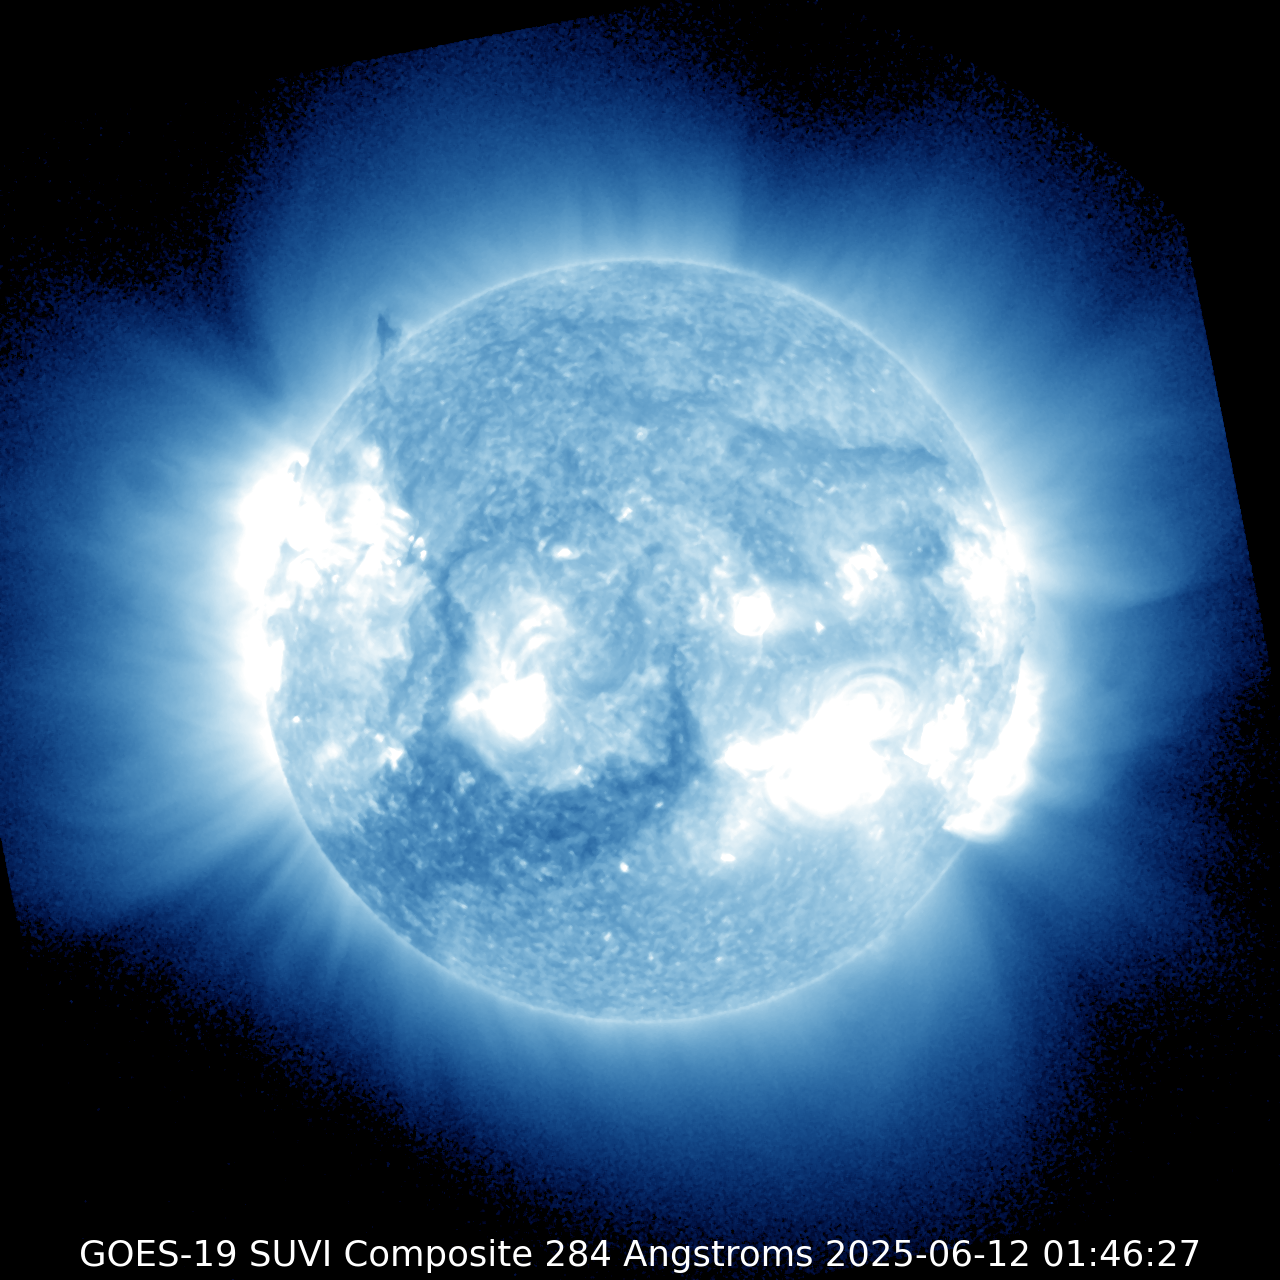
What you’re seeing: - **284Å (blue):** Very hot outer corona (about 2 million Kelvin) — best for spotting large coronal holes and general coronal structure. - **195Å (brown):** Lower corona (about 1.5 million Kelvin) — highlights active regions and flares. - **171Å (yellow):** Quiet corona and upper transition region (about 1 million Kelvin) — excellent for watching filament eruptions and small-scale loops.
Relevance: These images help forecasters detect sunspots, solar flares, and coronal holes — the origins of most space weather disturbances like CMEs and solar wind streams.
Signs of activity: - Bright, localized bursts: solar flares. - Large dark patches: coronal holes (source of high-speed solar wind). - Arcing loops or wave-like motions: magnetic field movement and eruptions.
If the Sun appears uniformly quiet and smooth, conditions are likely calm. If you see bright flashes or complex structures, it suggests active or eruptive conditions that may result in geomagnetic effects at Earth.
Learn more
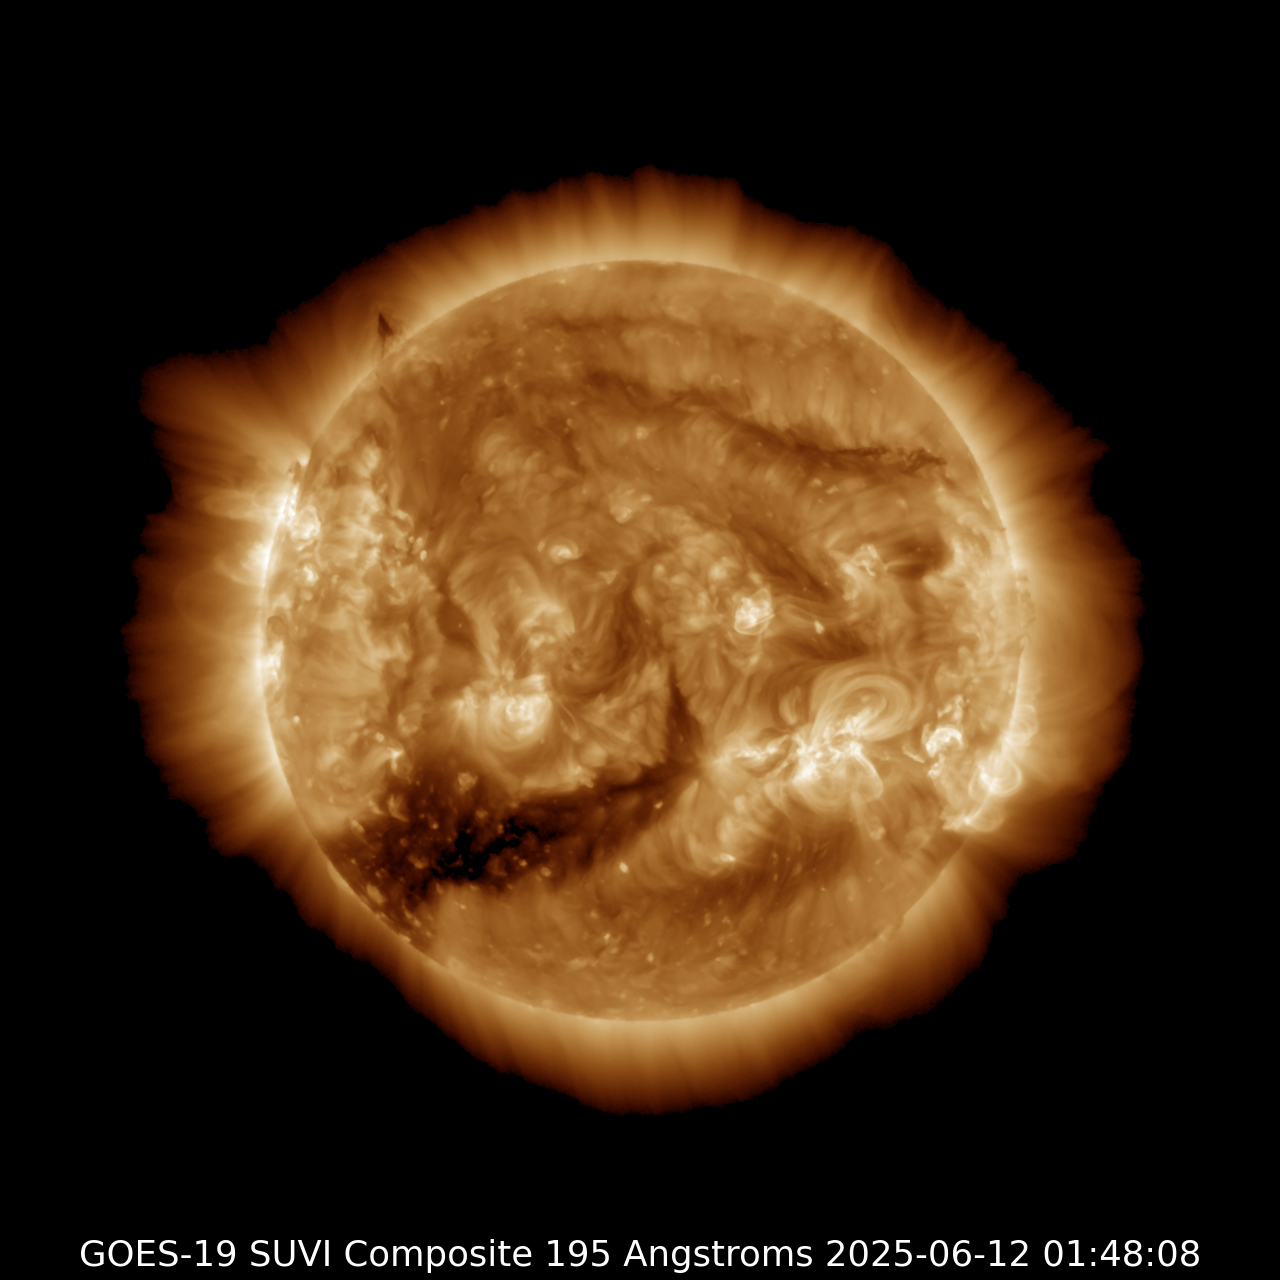
What you’re seeing: - **284Å (blue):** Very hot outer corona (about 2 million Kelvin) — best for spotting large coronal holes and general coronal structure. - **195Å (brown):** Lower corona (about 1.5 million Kelvin) — highlights active regions and flares. - **171Å (yellow):** Quiet corona and upper transition region (about 1 million Kelvin) — excellent for watching filament eruptions and small-scale loops.
Relevance: These images help forecasters detect sunspots, solar flares, and coronal holes — the origins of most space weather disturbances like CMEs and solar wind streams.
Signs of activity: - Bright, localized bursts: solar flares. - Large dark patches: coronal holes (source of high-speed solar wind). - Arcing loops or wave-like motions: magnetic field movement and eruptions.
If the Sun appears uniformly quiet and smooth, conditions are likely calm. If you see bright flashes or complex structures, it suggests active or eruptive conditions that may result in geomagnetic effects at Earth.
Learn more
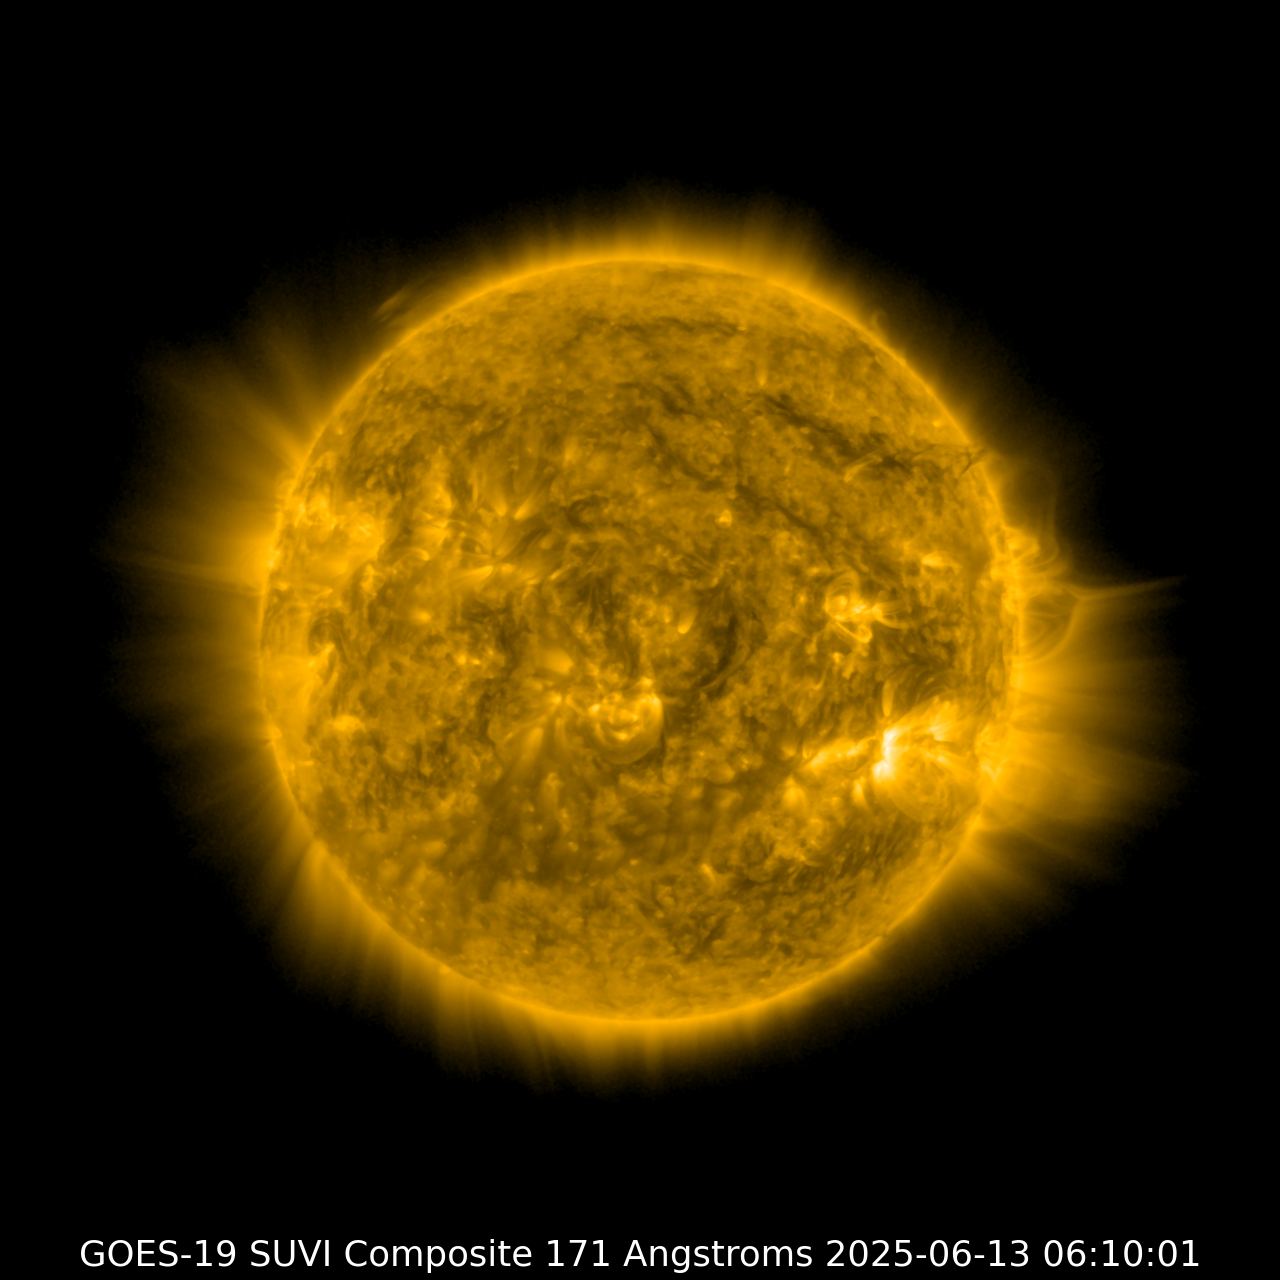
What you’re seeing: - **284Å (blue):** Very hot outer corona (about 2 million Kelvin) — best for spotting large coronal holes and general coronal structure. - **195Å (brown):** Lower corona (about 1.5 million Kelvin) — highlights active regions and flares. - **171Å (yellow):** Quiet corona and upper transition region (about 1 million Kelvin) — excellent for watching filament eruptions and small-scale loops.
Relevance: These images help forecasters detect sunspots, solar flares, and coronal holes — the origins of most space weather disturbances like CMEs and solar wind streams.
Signs of activity: - Bright, localized bursts: solar flares. - Large dark patches: coronal holes (source of high-speed solar wind). - Arcing loops or wave-like motions: magnetic field movement and eruptions.
If the Sun appears uniformly quiet and smooth, conditions are likely calm. If you see bright flashes or complex structures, it suggests active or eruptive conditions that may result in geomagnetic effects at Earth.
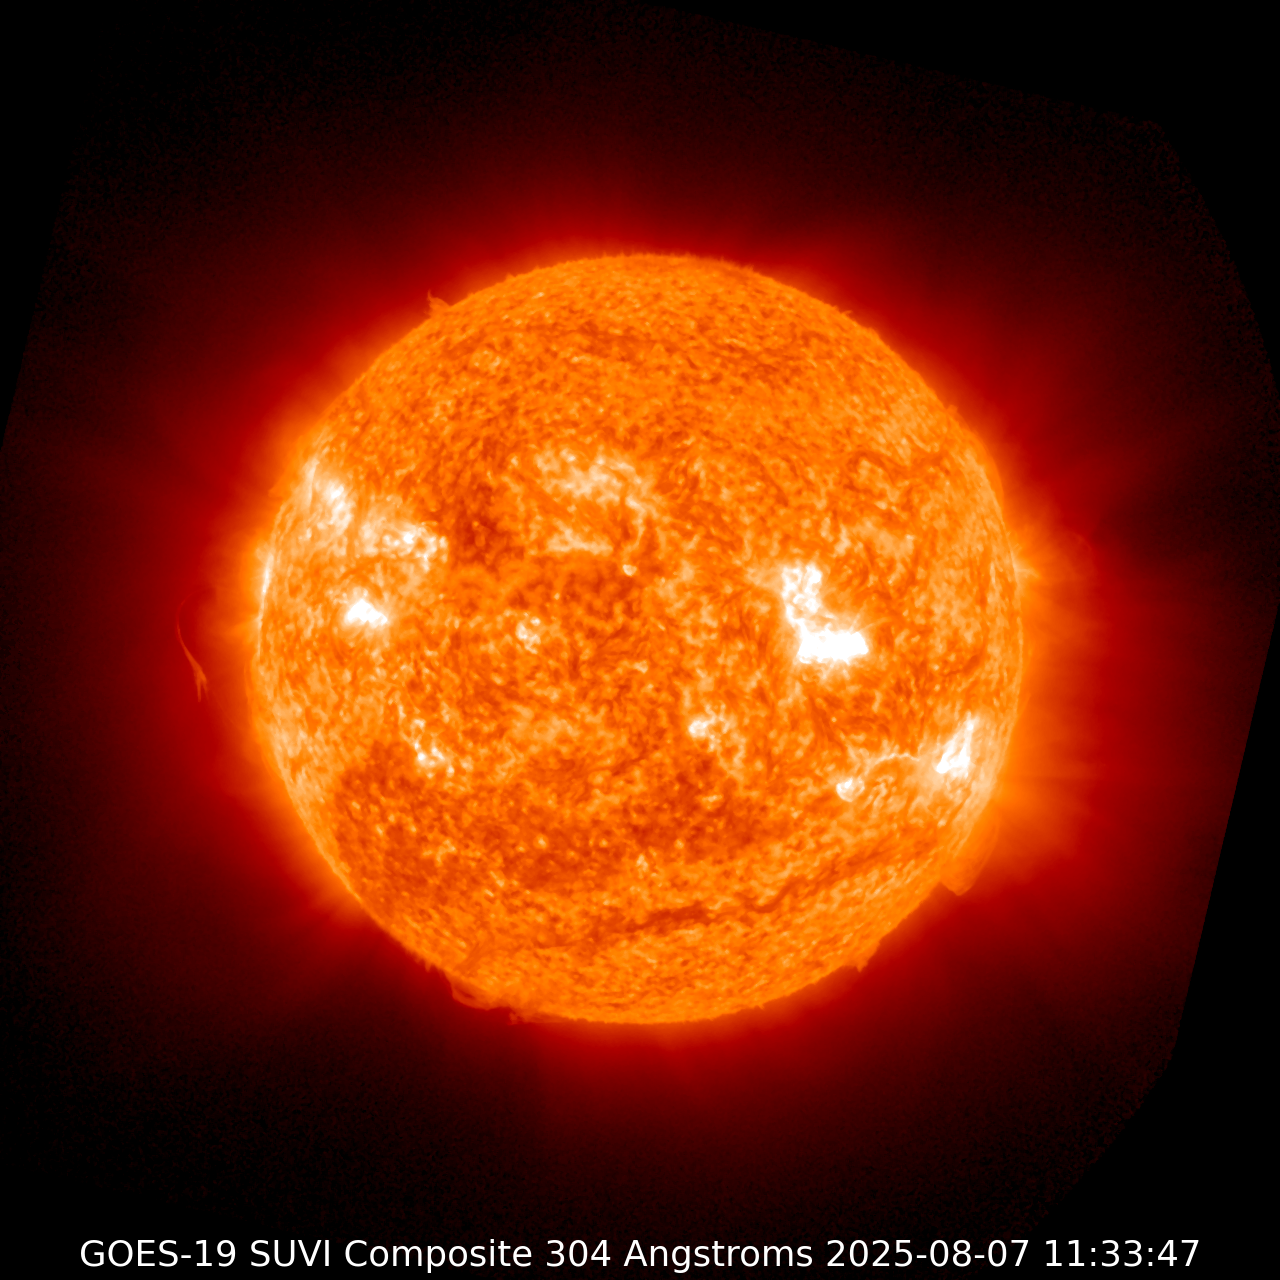
SUVI 304 Å
Learn more
What you’re seeing: - **284Å (blue):** Very hot outer corona (about 2 million Kelvin) — best for spotting large coronal holes and general coronal structure. - **195Å (brown):** Lower corona (about 1.5 million Kelvin) — highlights active regions and flares. - **171Å (yellow):** Quiet corona and upper transition region (about 1 million Kelvin) — excellent for watching filament eruptions and small-scale loops.
Relevance: These images help forecasters detect sunspots, solar flares, and coronal holes — the origins of most space weather disturbances like CMEs and solar wind streams.
Signs of activity: - Bright, localized bursts: solar flares. - Large dark patches: coronal holes (source of high-speed solar wind). - Arcing loops or wave-like motions: magnetic field movement and eruptions.
If the Sun appears uniformly quiet and smooth, conditions are likely calm. If you see bright flashes or complex structures, it suggests active or eruptive conditions that may result in geomagnetic effects at Earth.
June 2025
| Week Starting | Peak Kp | Level |
|---|---|---|
| Jun 30 | 5 | Minor Storm |
| Jun 23 | 3 | Quiet |
| Jun 16 | 4 | Unsettled |
| Jun 9 | 6 | Moderate Storm |
| Jun 2 | 5 | Minor Storm |
May 2025
| Week Starting | Peak Kp | Level |
|---|---|---|
| May 29 | 4 | Unsettled |
| May 22 | 6 | Moderate Storm |
| May 15 | 5 | Minor Storm |
| May 8 | 3 | Quiet |
| May 1 | 4 | Unsettled |
April 2025
| Week Starting | Peak Kp | Level |
|---|---|---|
| Apr 24 | 7 | Strong Storm |
| Apr 17 | 4 | Unsettled |
| Apr 10 | 6 | Moderate Storm |
| Apr 3 | 5 | Minor Storm |
March 2025
| Week Starting | Peak Kp | Level |
|---|---|---|
| Mar 31 | 6 | Moderate Storm |
| Mar 24 | 3 | Quiet |
| Mar 17 | 4 | Unsettled |
| Mar 10 | 5 | Minor Storm |
February 2025
| Week Starting | Peak Kp | Level |
|---|---|---|
| Feb 24 | 6 | Moderate Storm |
| Feb 17 | 5 | Minor Storm |
| Feb 10 | 4 | Unsettled |
| Feb 3 | 3 | Quiet |
January 2025
| Week Starting | Peak Kp | Level |
|---|---|---|
| Jan 27 | 5 | Minor Storm |
| Jan 20 | 3 | Quiet |
| Jan 13 | 4 | Unsettled |
| Jan 6 | 6 | Moderate Storm |
2024 KP INDEX WEEKLY PEAKS
Scroll to view Kp history
December 2024
| Week Starting | Peak Kp | Level |
|---|---|---|
| Dec 26 | 4 | Unsettled |
| Dec 19 | 3 | Quiet |
| Dec 12 | 6 | Moderate Storm |
| Dec 5 | 5 | Minor Storm |
November 2024
| Week Starting | Peak Kp | Level |
|---|---|---|
| Nov 28 | 4 | Unsettled |
| Nov 21 | 6 | Moderate Storm |
| Nov 14 | 5 | Minor Storm |
| Nov 7 | 4 | Unsettled |
October 2024
| Week Starting | Peak Kp | Level |
|---|---|---|
| Oct 31 | 7 | Strong Storm |
| Oct 24 | 3 | Quiet |
| Oct 17 | 6 | Moderate Storm |
| Oct 10 | 5 | Minor Storm |
| Oct 3 | 4 | Unsettled |
September 2024
| Week Starting | Peak Kp | Level |
|---|---|---|
| Sep 26 | 7 | Strong Storm |
| Sep 19 | 6 | Moderate Storm |
| Sep 12 | 3 | Quiet |
| Sep 5 | 5 | Minor Storm |
August 2024
| Week Starting | Peak Kp | Level |
|---|---|---|
| Aug 29 | 4 | Unsettled |
| Aug 22 | 6 | Moderate Storm |
| Aug 15 | 3 | Quiet |
| Aug 8 | 5 | Minor Storm |
| Aug 1 | 4 | Unsettled |
July 2024
| Week Starting | Peak Kp | Level |
|---|---|---|
| Jul 25 | 3 | Quiet |
| Jul 18 | 5 | Minor Storm |
| Jul 11 | 4 | Unsettled |
| Jul 4 | 3 | Quiet |
June 2024
| Week Starting | Peak Kp | Level |
|---|---|---|
| Jun 27 | 4 | Unsettled |
| Jun 20 | 6 | Moderate Storm |
| Jun 13 | 5 | Minor Storm |
| Jun 6 | 4 | Unsettled |
May 2024
| Week Starting | Peak Kp | Level |
|---|---|---|
| May 30 | 6 | Moderate Storm |
| May 23 | 5 | Minor Storm |
| May 16 | 4 | Unsettled |
| May 9 | 3 | Quiet |
| May 2 | 3 | Quiet |
April 2024
| Week Starting | Peak Kp | Level |
|---|---|---|
| Apr 25 | 6 | Moderate Storm |
| Apr 18 | 3 | Quiet |
| Apr 11 | 4 | Unsettled |
| Apr 4 | 5 | Minor Storm |
March 2024
| Week Starting | Peak Kp | Level |
|---|---|---|
| Mar 28 | 5 | Minor Storm |
| Mar 21 | 6 | Moderate Storm |
| Mar 14 | 3 | Quiet |
| Mar 7 | 4 | Unsettled |
February 2024
| Week Starting | Peak Kp | Level |
|---|---|---|
| Feb 29 | 4 | Unsettled |
| Feb 22 | 6 | Moderate Storm |
| Feb 15 | 5 | Minor Storm |
| Feb 8 | 4 | Unsettled |
| Feb 1 | 3 | Quiet |
January 2024
| Week Starting | Peak Kp | Level |
|---|---|---|
| Jan 25 | 4 | Unsettled |
| Jan 18 | 5 | Minor Storm |
| Jan 11 | 3 | Quiet |
| Jan 4 | 3 | Quiet |